
Data insights as a product
An approach and framework for optimizing the impact of data for reporting & analytics

In this post, I’ll dive into an approach to building data insights as a product; this is primarily for teams building data warehouse solutions to enable reporting & analytics at their companies. In the past, this type of data product was either highly reactive with a lot of ad-hoc tables built to quickly respond to business requests, or a slowly evolving monolithic data warehouse not agile enough for a fast moving business.
So, as the PM (or analytics lead) for this type of solution how should you approach it?
Understand your customers, their data savviness and what they care about
Map out the data use cases from reporting to ad-hoc insights to ML
Create and update a scorecard on your data product based on how well you deliver on data foundations, coverage, delivery, agility and strategy
Understand your data customers
First, let’s start by more clearly understanding our customers. In most cases, the customers of this data product are a mixture of analysts who will generate insights/dashboards and business users who are not very technical but need to use data to run the business or improve the product. As you talk to your customers and outline their needs, be sure to ask yourself several key questions:
How data savvy are your non-technical users? Do they understand how nuances metric definitions can lead to different answers? Are they able to sift through data themselves to find answers or are they limited to things like excel and Tableau dashboards?
How do they use data to run the business? What are their daily/weekly/monthly reporting needs? How do they use data to direct strategic planning? Where and how do they consume data (asynchronous reporting? weekly meetings?)
Understanding the data culture of your customer base and how they use data for reporting & analytics will help you architect the data product and its delivery mechanisms better
Map out your data use cases
Next, we’ll want to map out the common use cases they have of data. This starts with things like daily reports, but can quickly expand to cover lots of different use cases for reporting and analytics. Some questions you may want to consider include:
What are the expectations and needs for daily reports? When does it need to be available and how reliable does it need to be? Are some reports more important than others? Where is there a strong need for consistency across reports?
How does the business think about new datasets? How frequently do you need to pull in a new dataset from a partner or 3rd party to evaluate a new initiative?
What are the styles of the ad-hoc insights that the business needs?
How and when does the business ask its strategic questions that affect multi-quarter roadmaps?
What’s the role of advanced data science and ML in strategy and roadmapping?
Depending on the criticality of your data use cases, your data team should index towards certain functionality over others (reporting, self-service BI, ML, etc)
Create and maintain a product scorecard
Finally, you can build up a scorecard for your data product based on how well it meets your customers and their use cases. The scorecard is a nice rubric that you can use to evaluate how well you’re doing over time and where you should increase or decrease focus as time goes on. The scorecard would include:
Data foundations: your base dimensional model that represents the product in your analytics environment as well as your data monitoring and quality
Data coverage: how well does your data model cover all the important aspects of your product from acquisition through to engagement and revenue? Mapping your ability to deliver analytics to the pirate’s metric framework is a good start
Data delivery: how well do your customers understand and use your data? Do you need to invest in self-service BI to expand your reach? Do you need to promote training or governance to help people use the right data for the right use cases?
Data agility: how well does your team respond to a quickly changing environment? How quickly can you get signals on the success of a new release, evaluate a new space for growth, or incorporate data from a partner?
Data & strategy: how well does your data affect strategic decision making? Are you able to generate deep, nuanced analytics to understand your customers better and inform multi-quarter roadmaps? Are you able to implement more robust analytics via statistics or ML to inform strategies?
With this scorecard, you can see where you may want to increase or decrease focus
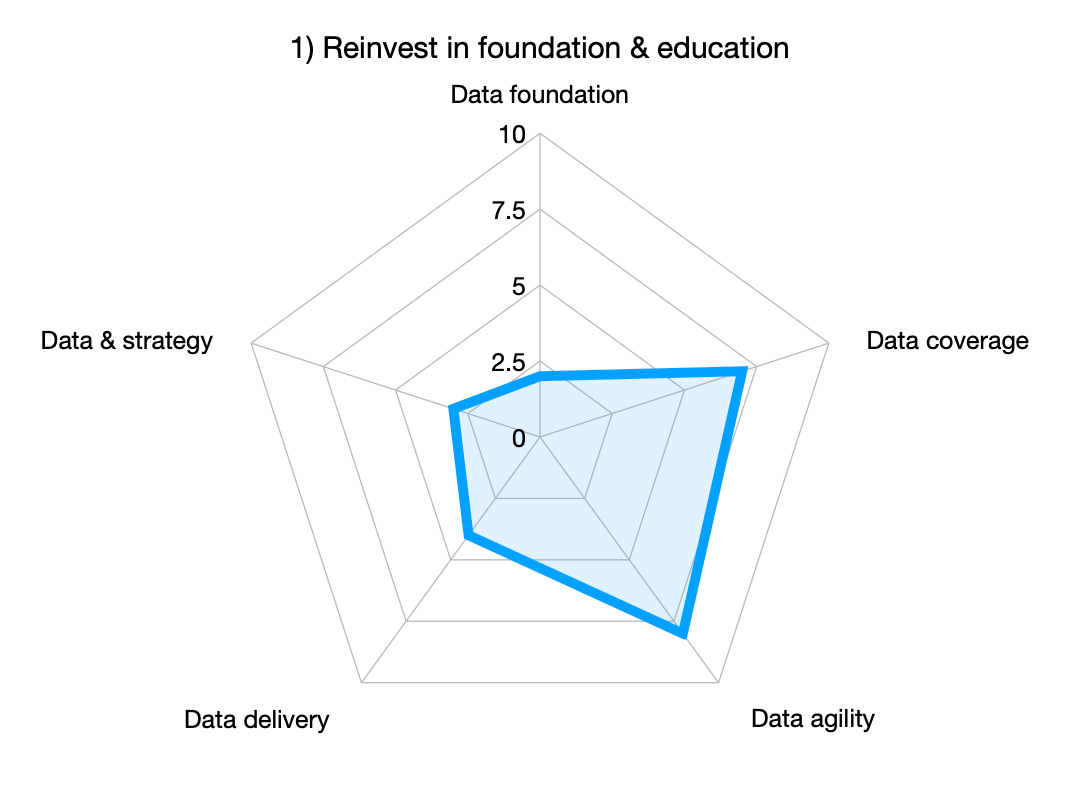
Example 1: your team has great coverage and agility, but your foundation is weak and the strategic element and delivery are lagging. You may need to reinvest in your foundation so that you can trust your insights so that you can move faster in the long run and couple that with education on data culture for your user base to improve delivery

Example 2: your team has a strong foundation, decent coverage and delivery, but no agility or strategic ability. This sounds like many monolithic data warehouse organizations where they can’t adjust to the market
When building data for reporting & analytics, your team is looking to strike the right balance between stability and agility. By understanding your customers better, mapping out their use cases, and then scoring yourselves on the health of your data product, you have a framework and a compass to incrementally improve the quality and value of your data insights.